
Page 32 - 2024-calc4e-SE proofs-4e.indd
P. 32
Sullivan 04 apcalc4e 45342 ch02 166 233 5pp August 7, 2023 12:54
182 Chapter 2 • The Derivative and Its Properties
3
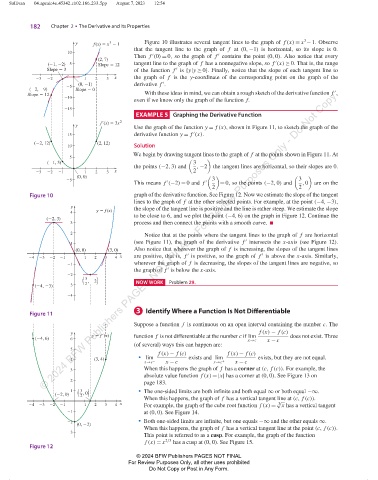
y f (x) 5 x 2 1 Figure 10 illustrates several tangent lines to the graph of f (x) = x − 1. Observe
3
that the tangent line to the graph of f at (0, −1) is horizontal, so its slope is 0.
10
Then f (0) = 0, so the graph of f contains the point (0, 0). Also notice that every
′
′
(2, 7)
′
(21, 22) 5 Slope 5 12 tangent line to the graph of f has a nonnegative slope, so f (x) ≥ 0. That is, the range
Slope 5 3 of the function f is {y|y ≥ 0}. Finally, notice that the slope of each tangent line to
′
23 22 1 2 3 x the graph of f is the y-coordinate of the corresponding point on the graph of the
(0, 21) derivative f . ′
© 2024 BFW Publishers PAGES NOT FINAL - For Review Purposes Only - Do Not Copy.
25
(22, 29) Slope 5 0
′
Slope 5 12 With these ideas in mind, we can obtain a rough sketch of the derivative function f ,
210
even if we know only the graph of the function f.
215
EXAMPLE 5 Graphing the Derivative Function
f'(x) 5 3x 2
y
Use the graph of the function y = f (x), shown in Figure 11, to sketch the graph of the
′
15 derivative function y = f (x).
(22, 12) (2, 12)
10 Solution
We begin by drawing tangent lines to the graph of f at the points shown in Figure 11. At
5
(21, 3) 3
the points (−2, 3) and , −2 the tangent lines are horizontal, so their slopes are 0.
23 22 21 1 2 3 x 2
(0, 0)
25 3 3
This means f (−2) = 0 and f ′ = 0, so the points (−2, 0) and , 0 are on the
′
2 2
Figure 10 graph of the derivative function. See Figure 12. Now we estimate the slope of the tangent
lines to the graph of f at the other selected points. For example, at the point (−4, −3),
y
y f (x) the slope of the tangent line is positive and the line is rather steep. We estimate the slope
4
to be close to 6, and we plot the point (−4, 6) on the graph in Figure 12. Continue the
(2, 3)
3 process and then connect the points with a smooth curve.
2
Notice that at the points where the tangent lines to the graph of f are horizontal
(see Figure 11), the graph of the derivative f intersects the x-axis (see Figure 12).
′
1
(0, 0) (3, 0) Also notice that wherever the graph of f is increasing, the slopes of the tangent lines
′
′
4 3 2 1 1 2 3 4 x are positive, that is, f is positive, so the graph of f is above the x-axis. Similarly,
1 wherever the graph of f is decreasing, the slopes of the tangent lines are negative, so
′
the graph of f is below the x-axis.
2
(, 2) NOW WORK Problem 29.
3
(4, 3) 3 2
4
3 Identify Where a Function Is Not Differentiable
Figure 11
Suppose a function f is continuous on an open interval containing the number c. The
y y f !(x) f (x) − f (c)
(4, 6) 6 function f is not differentiable at the number c if lim does not exist. Three
x→c x − c
(of several) ways this can happen are:
5
f (x) − f (c) f (x) − f (c)
4 (3, 4) • lim exists and lim exists, but they are not equal.
x→c − x − c x→c + x − c
When this happens the graph of f has a corner at (c, f (c)). For example, the
3
absolute value function f (x) = |x| has a corner at (0, 0). See Figure 13 on
2
page 183.
(2, 0) (, 0) • The one-sided limits are both infinite and both equal ∞ or both equal −∞.
3
1
2
When this happens, the graph of f has a vertical tangent line at (c, f (c)).
3
4 3 2 1 1 2 3 4 x For example, the graph of the cube root function f (x) = √ x has a vertical tangent
1 at (0, 0). See Figure 14.
2 • Both one-sided limits are infinite, but one equals −∞ and the other equals ∞.
(0, 2)
When this happens, the graph of f has a vertical tangent line at the point (c, f (c)).
3
This point is referred to as a cusp. For example, the graph of the function
f (x) = x 2/3 has a cusp at (0, 0). See Figure 15.
Figure 12
© 2024 BFW Publishers PAGES NOT FINAL
For Review Purposes Only, all other uses prohibited
Do Not Copy or Post in Any Form.